EcoViz: an iterative methodology for designing multifaceted data-driven environmental visualizations that communicate ecosystem impacts and envision nature-based solutions
Jessica Marielle Kendall-Bar - University of California, San Diego, San Diego, United States
Isaac Nealey - University of California, San Diego, La Jolla, United States
Ian Costello - University of California, Santa Cruz, Santa Cruz, United States
Christopher Lowrie - University of California, Santa Cruz, Santa Cruz, United States
Kevin Huynh Nguyen - University of California, San Diego, San Diego, United States
Paul J. Ponganis - University of California San Diego, La Jolla, United States
Michael W. Beck - University of California, Santa Cruz, Santa Cruz, United States
İlkay Altıntaş - University of California, San Diego, San Diego, United States
Room: Esplanade Suites I + II + III
2024-10-14T12:30:00ZGMT-0600Change your timezone on the schedule page
2024-10-14T12:30:00Z

Fast forward
Abstract
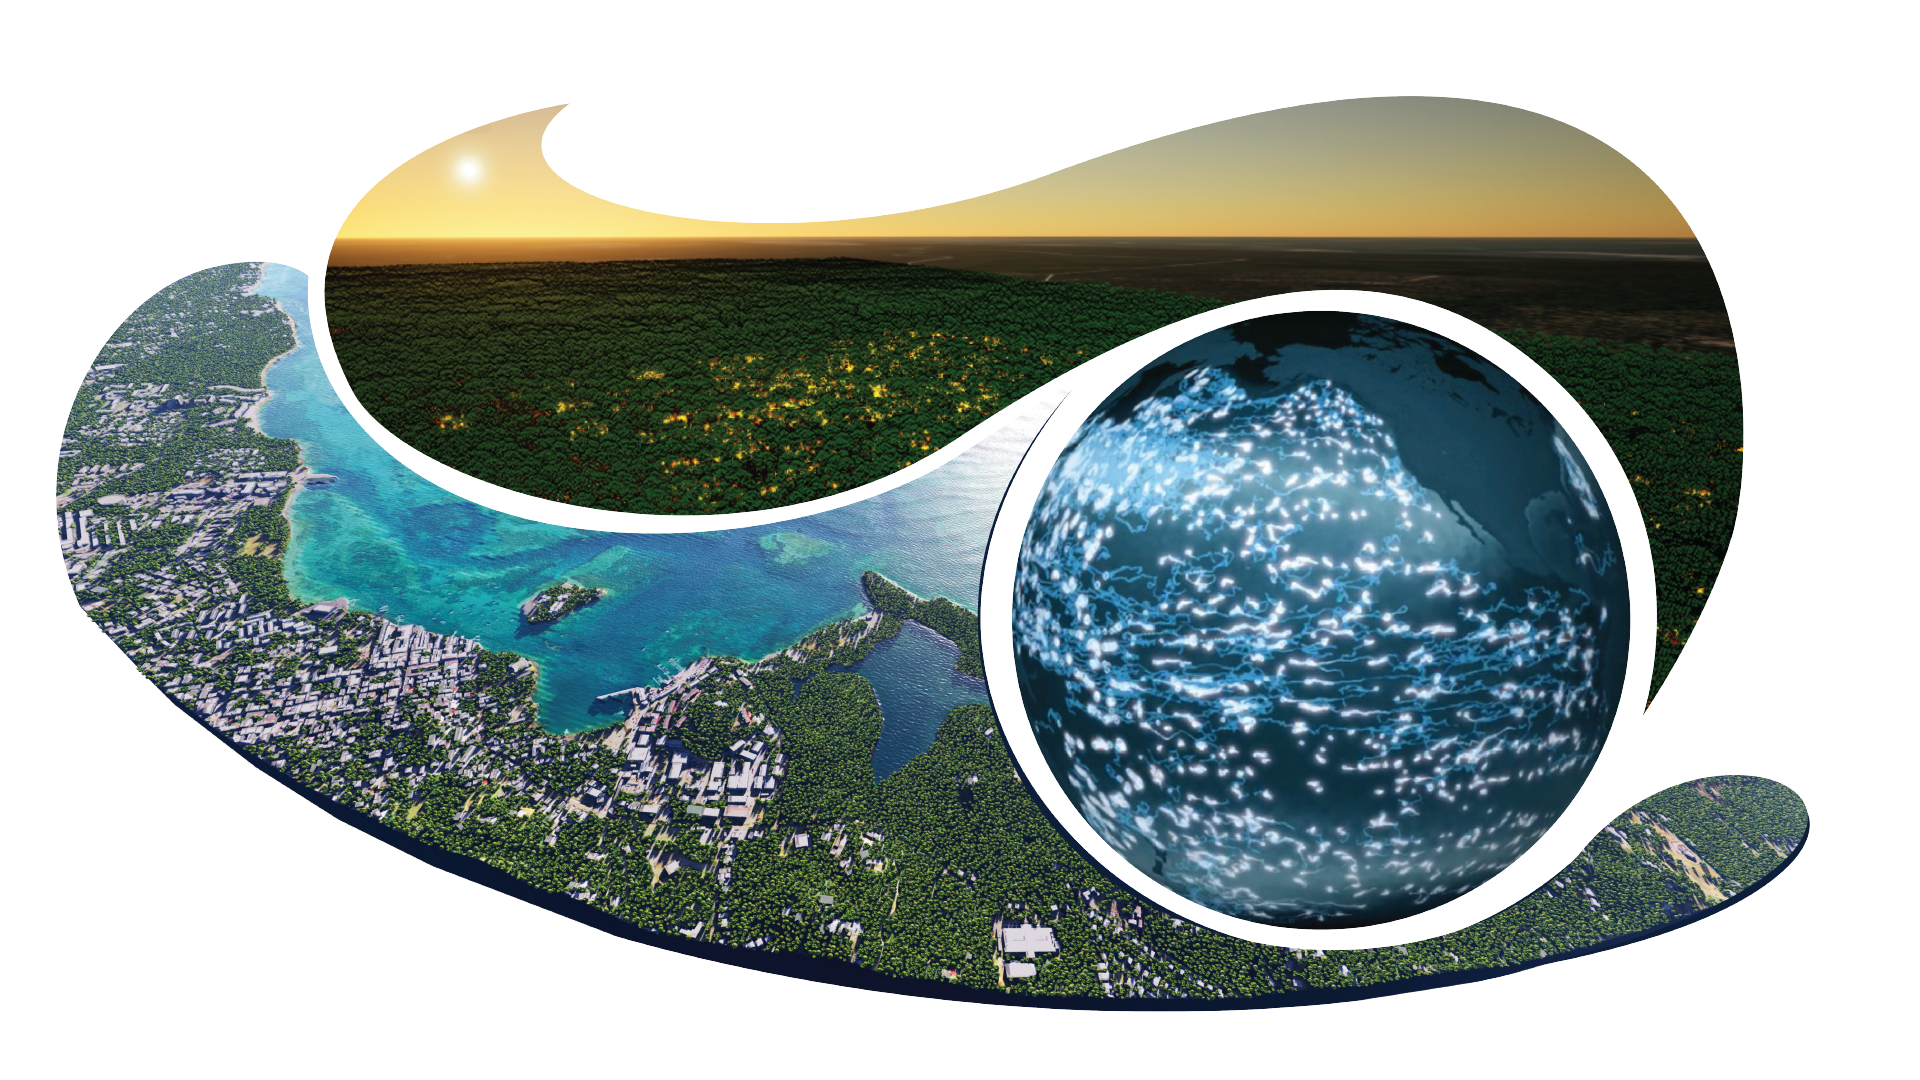
Climate change’s global impact calls for coordinated visualization efforts to enhance collaboration and communication among key partners such as domain experts, community members, and policy makers. We present a collaborative initiative, EcoViz, where visualization practitioners and key partners co-designed environmental data visualizations to illustrate impacts on ecosystems and the benefit of informed management and nature-based solutions. Our three use cases rely on unique processing pipelines to represent time-dependent natural phenomena by combining cinematic, scientific, and information visualization methods. Scientific outputs are displayed through narrative data-driven animations, interactive geospatial web applications, and immersive Unreal Engine applications. Each field’s decision-making process is specific, driving design decisions about the best representation and medium for each use case. Data-driven cinematic videos with simple charts and minimal annotations proved most effective for engaging large, diverse audiences. This flexible medium facilitates reuse, maintains critical details, and integrates well into broader narrative videos. The need for interdisciplinary visualizations highlights the importance of funding to integrate visualization practitioners throughout the scientific process to better translate data and knowledge into informed policy and practice.