Visualizing Climate Model Outputs with CliMAScope
Linh Pham -
Kevin Hu -
Nathan White -
Minyoung Joo -
Alexandre Renchon -
Tapio Schneider -
Krys Blackwood -
Santiago Lombeyda -
Hillary Mushkin -
Scott Davidoff -
Screen-reader Accessible PDF
Download Supplemental Material
Room: Room 1.14
2025-11-05T13:54:00.000ZGMT-0600Change your timezone on the schedule page
2025-11-05T13:54:00.000Z
https://youtu.be/pZq0H_l-8Bs
Keywords
visual analytics, design study climate model
Abstract
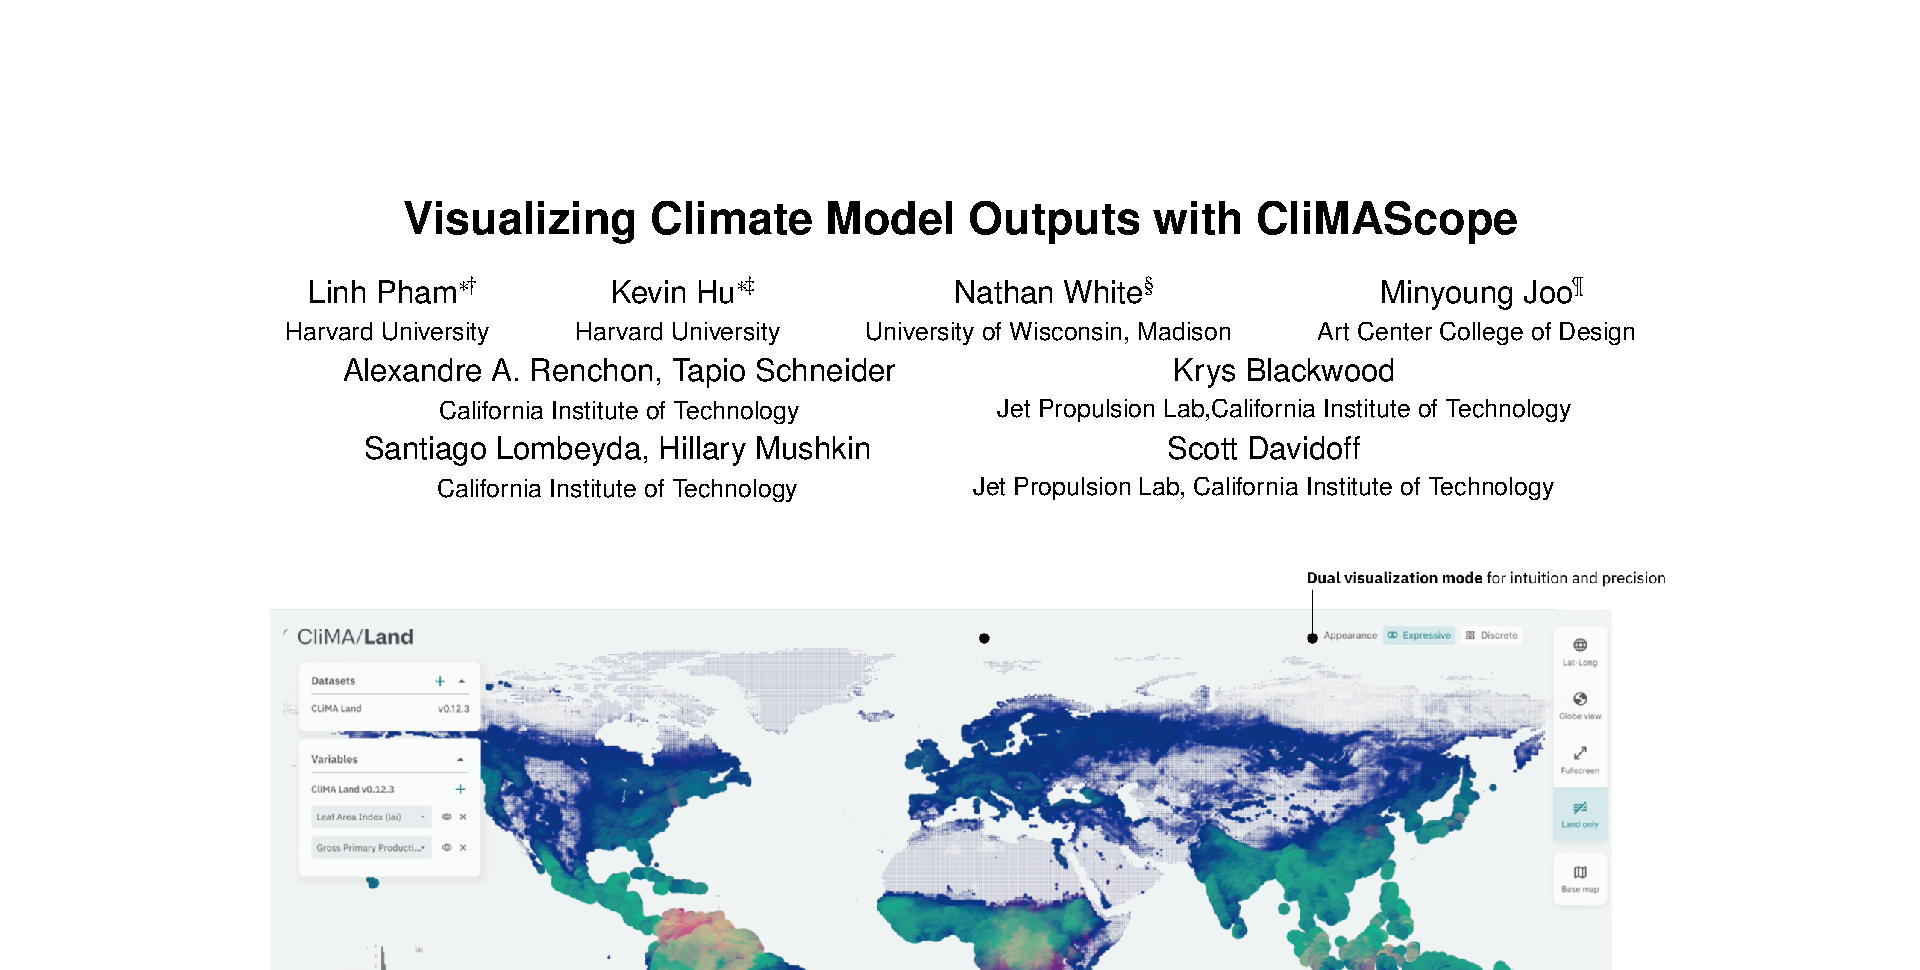
With the increasing complexity and diversity of climate models, climate scientists often turn to multiple tools to understand and assess relationships between observations and model output. To explore ways to overcome that workflow complexity, we partnered with the Climate Modeling Alliance (CliMA) to develop CliMAScope. CliMAScope is an open source, interactive, web-based land surface climate model visualization tool that aims to unify analysis, comparison, validation, and correlation mapping of observational data with climate land model output. This paper presents a design study of CliMAScope, and explains how the tool's visual and interactive elements support the goal of comparing seamless climate model outputs to observational data.